Points de repère, 2013.
3D animation with sound.
6 min. 5 sec. loop.
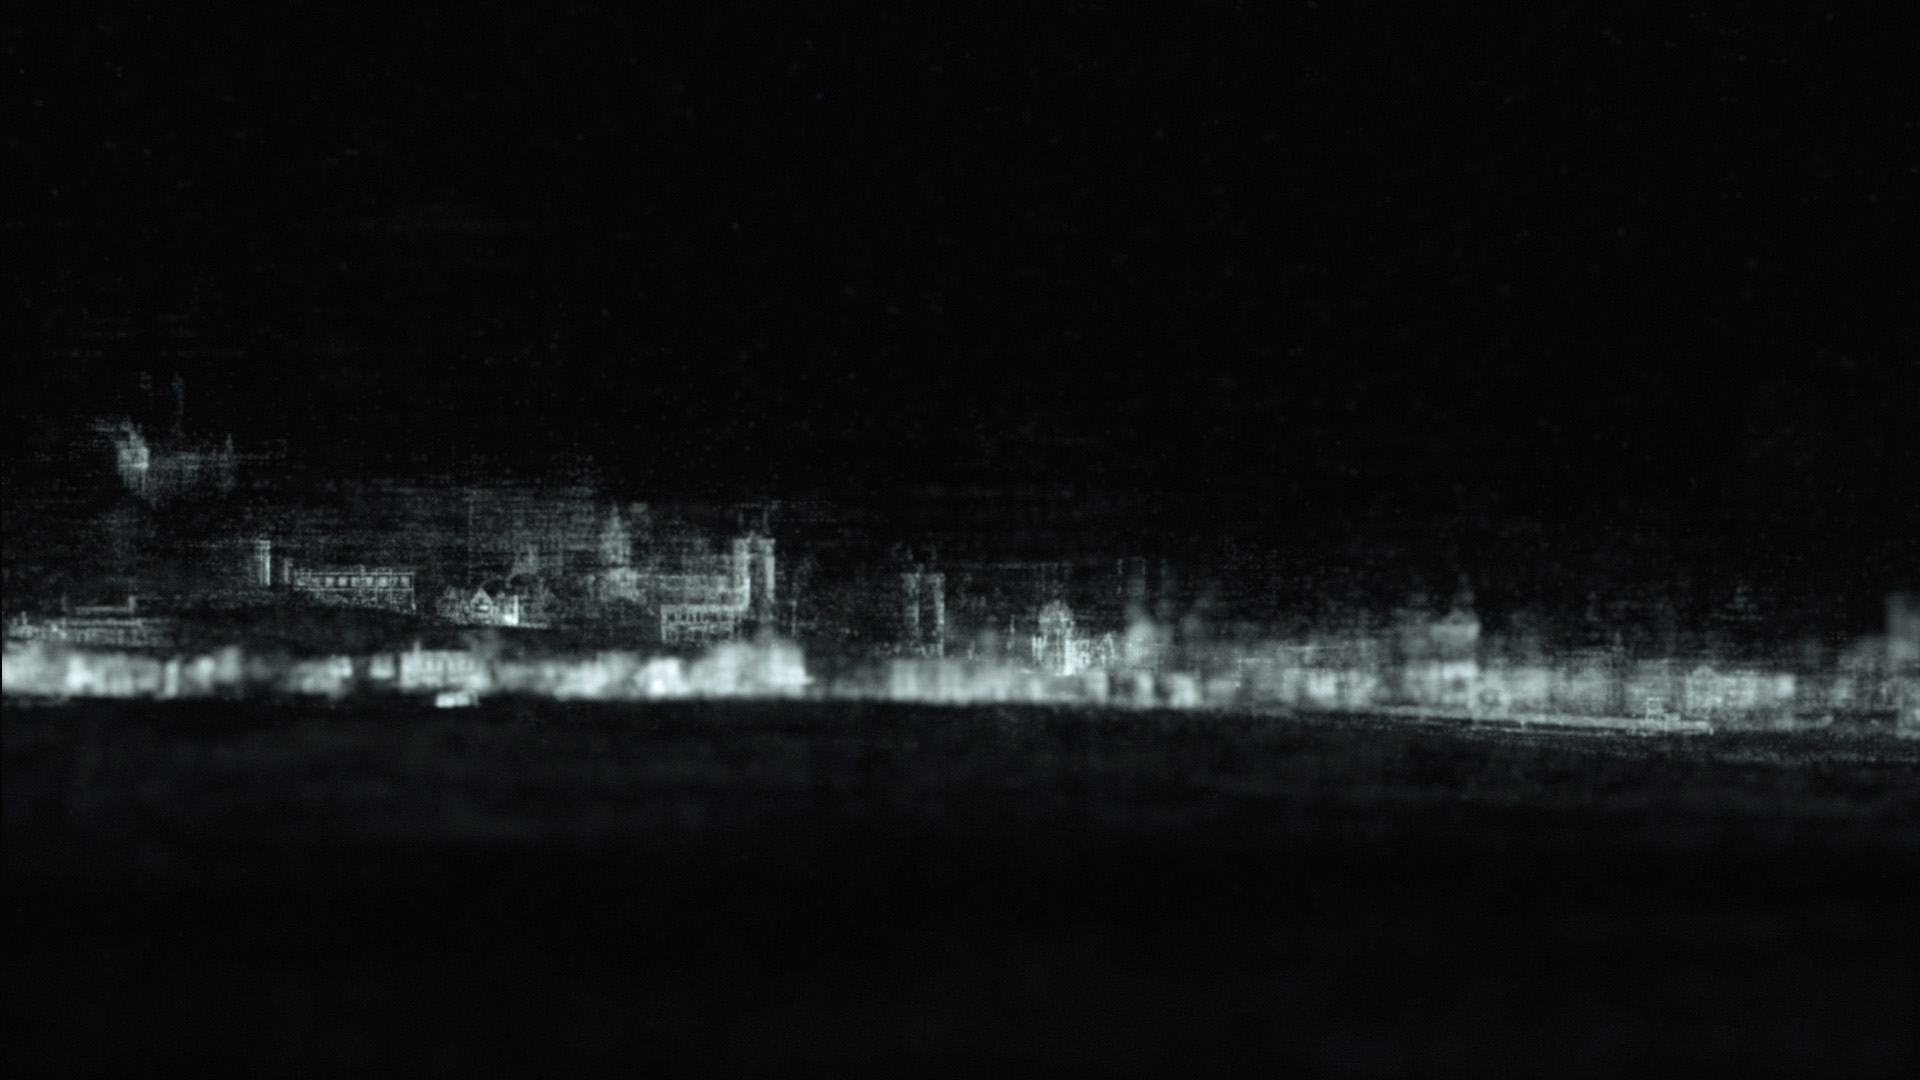
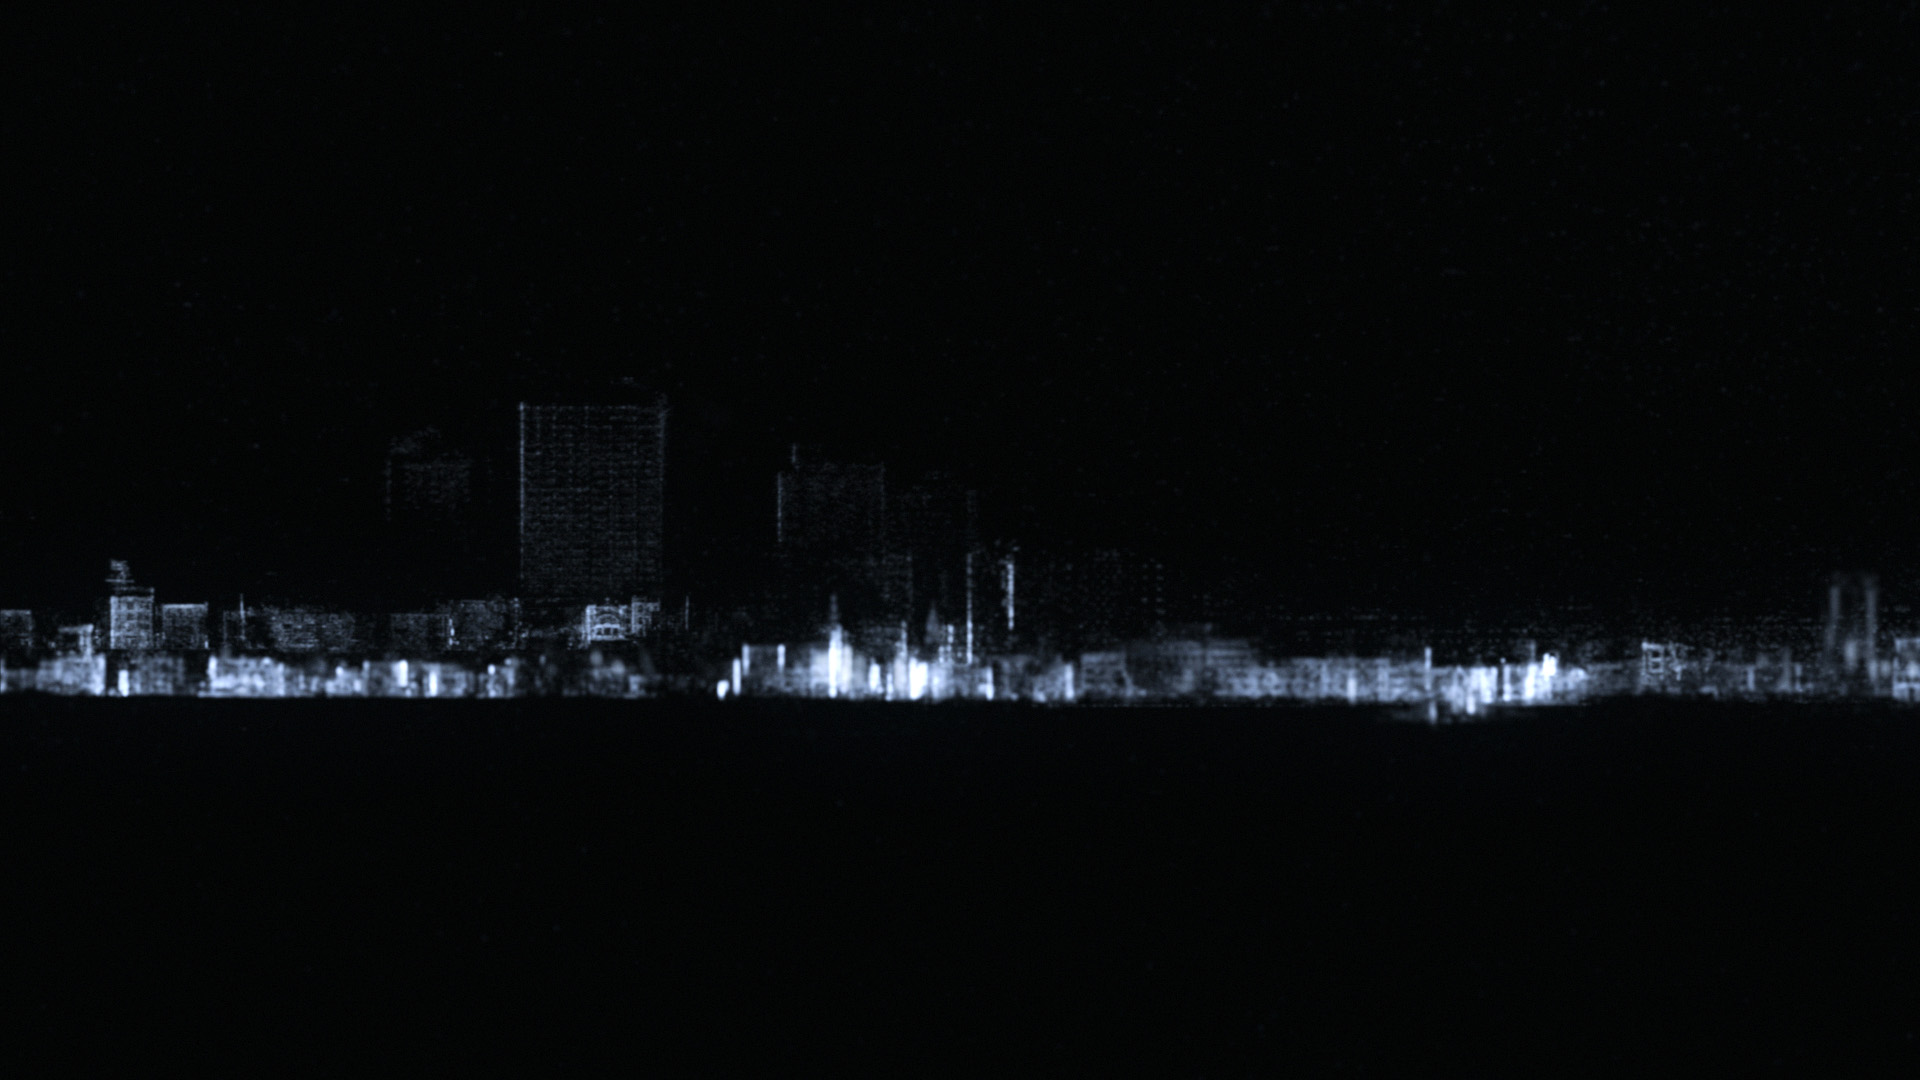
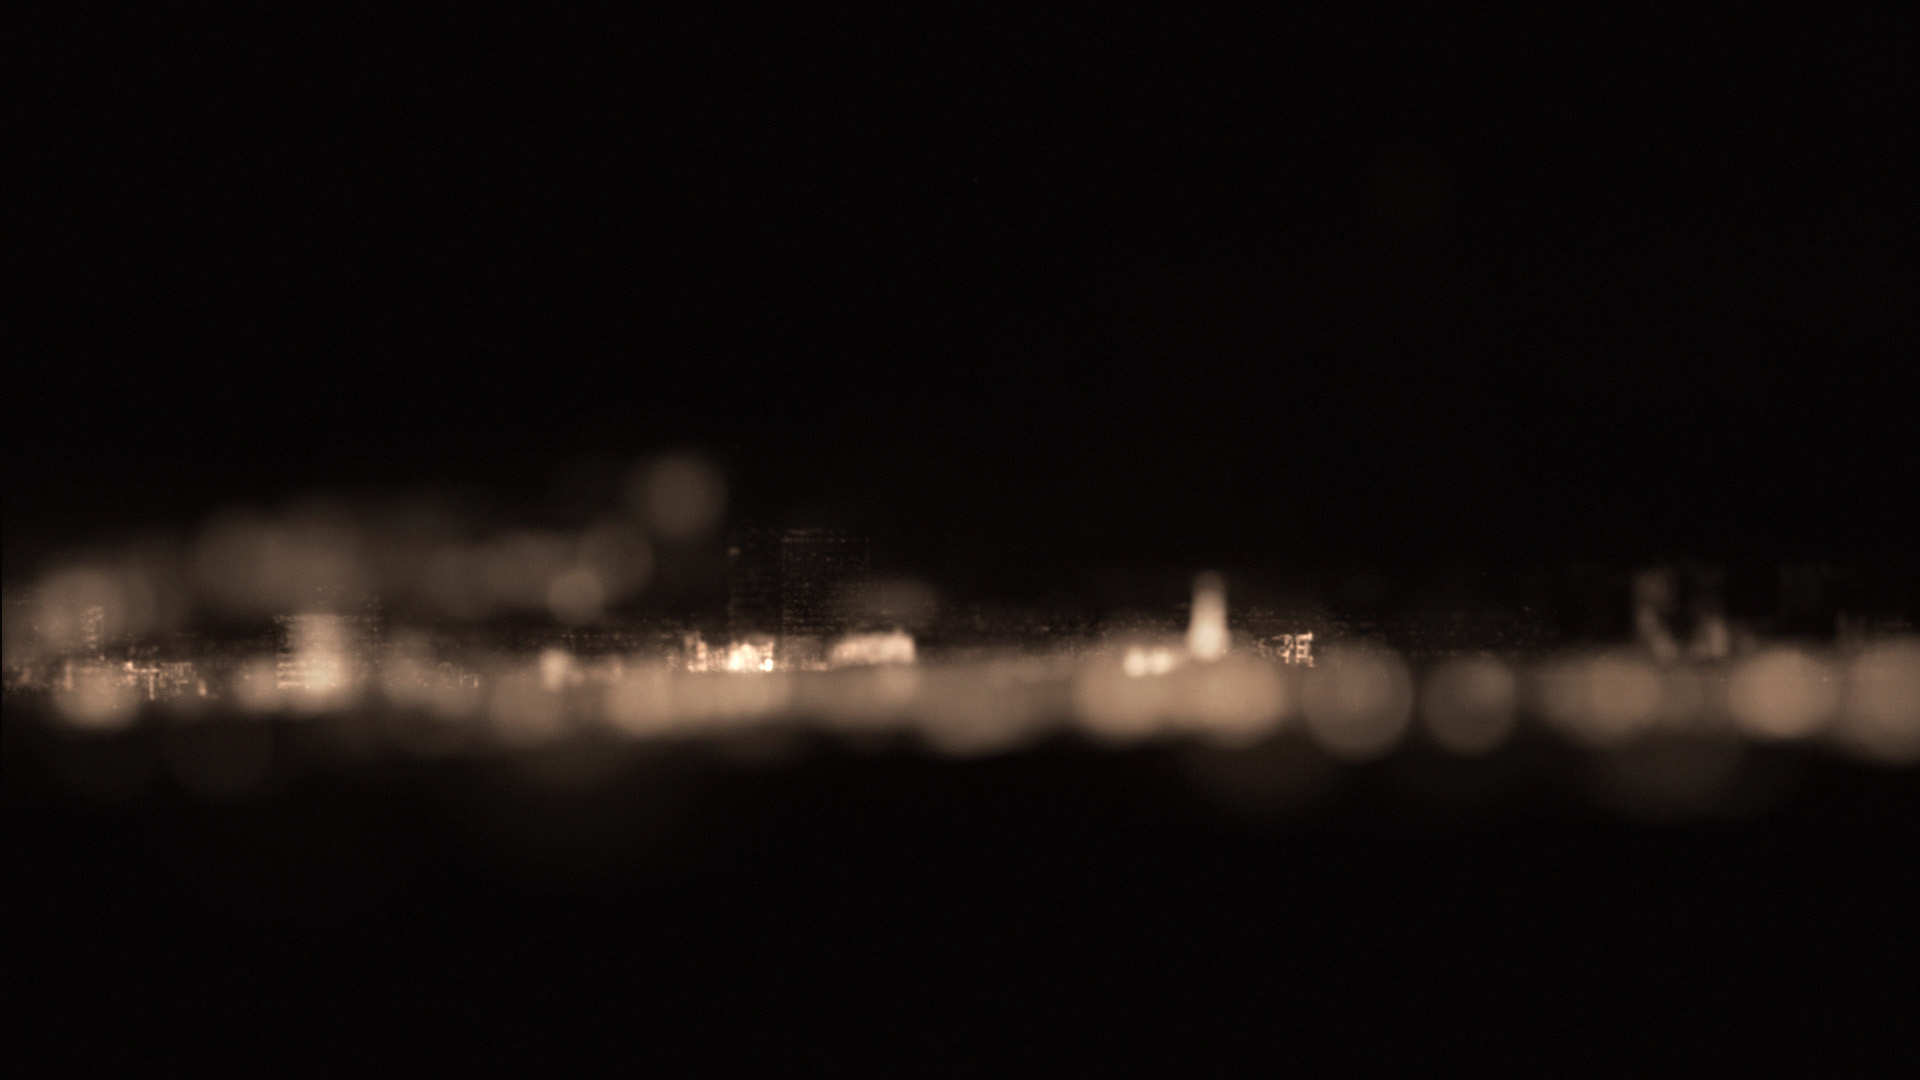
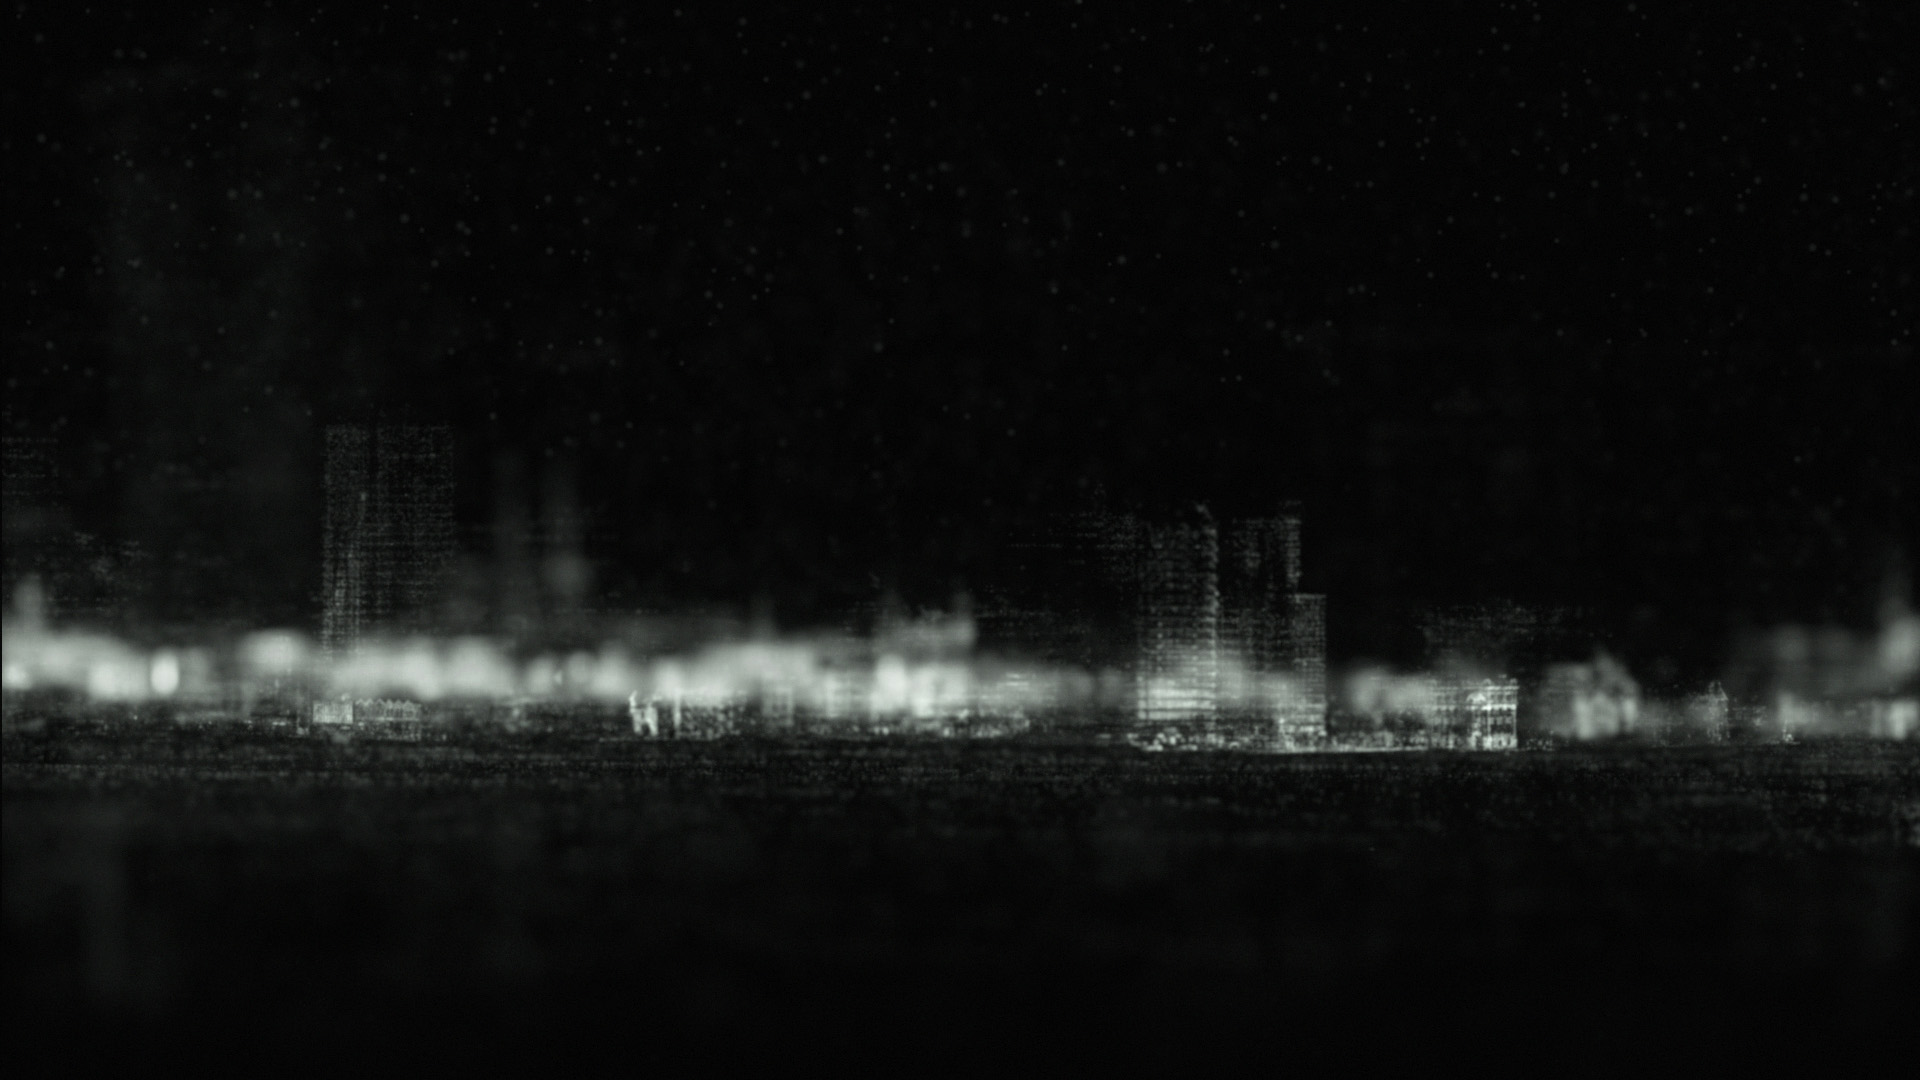
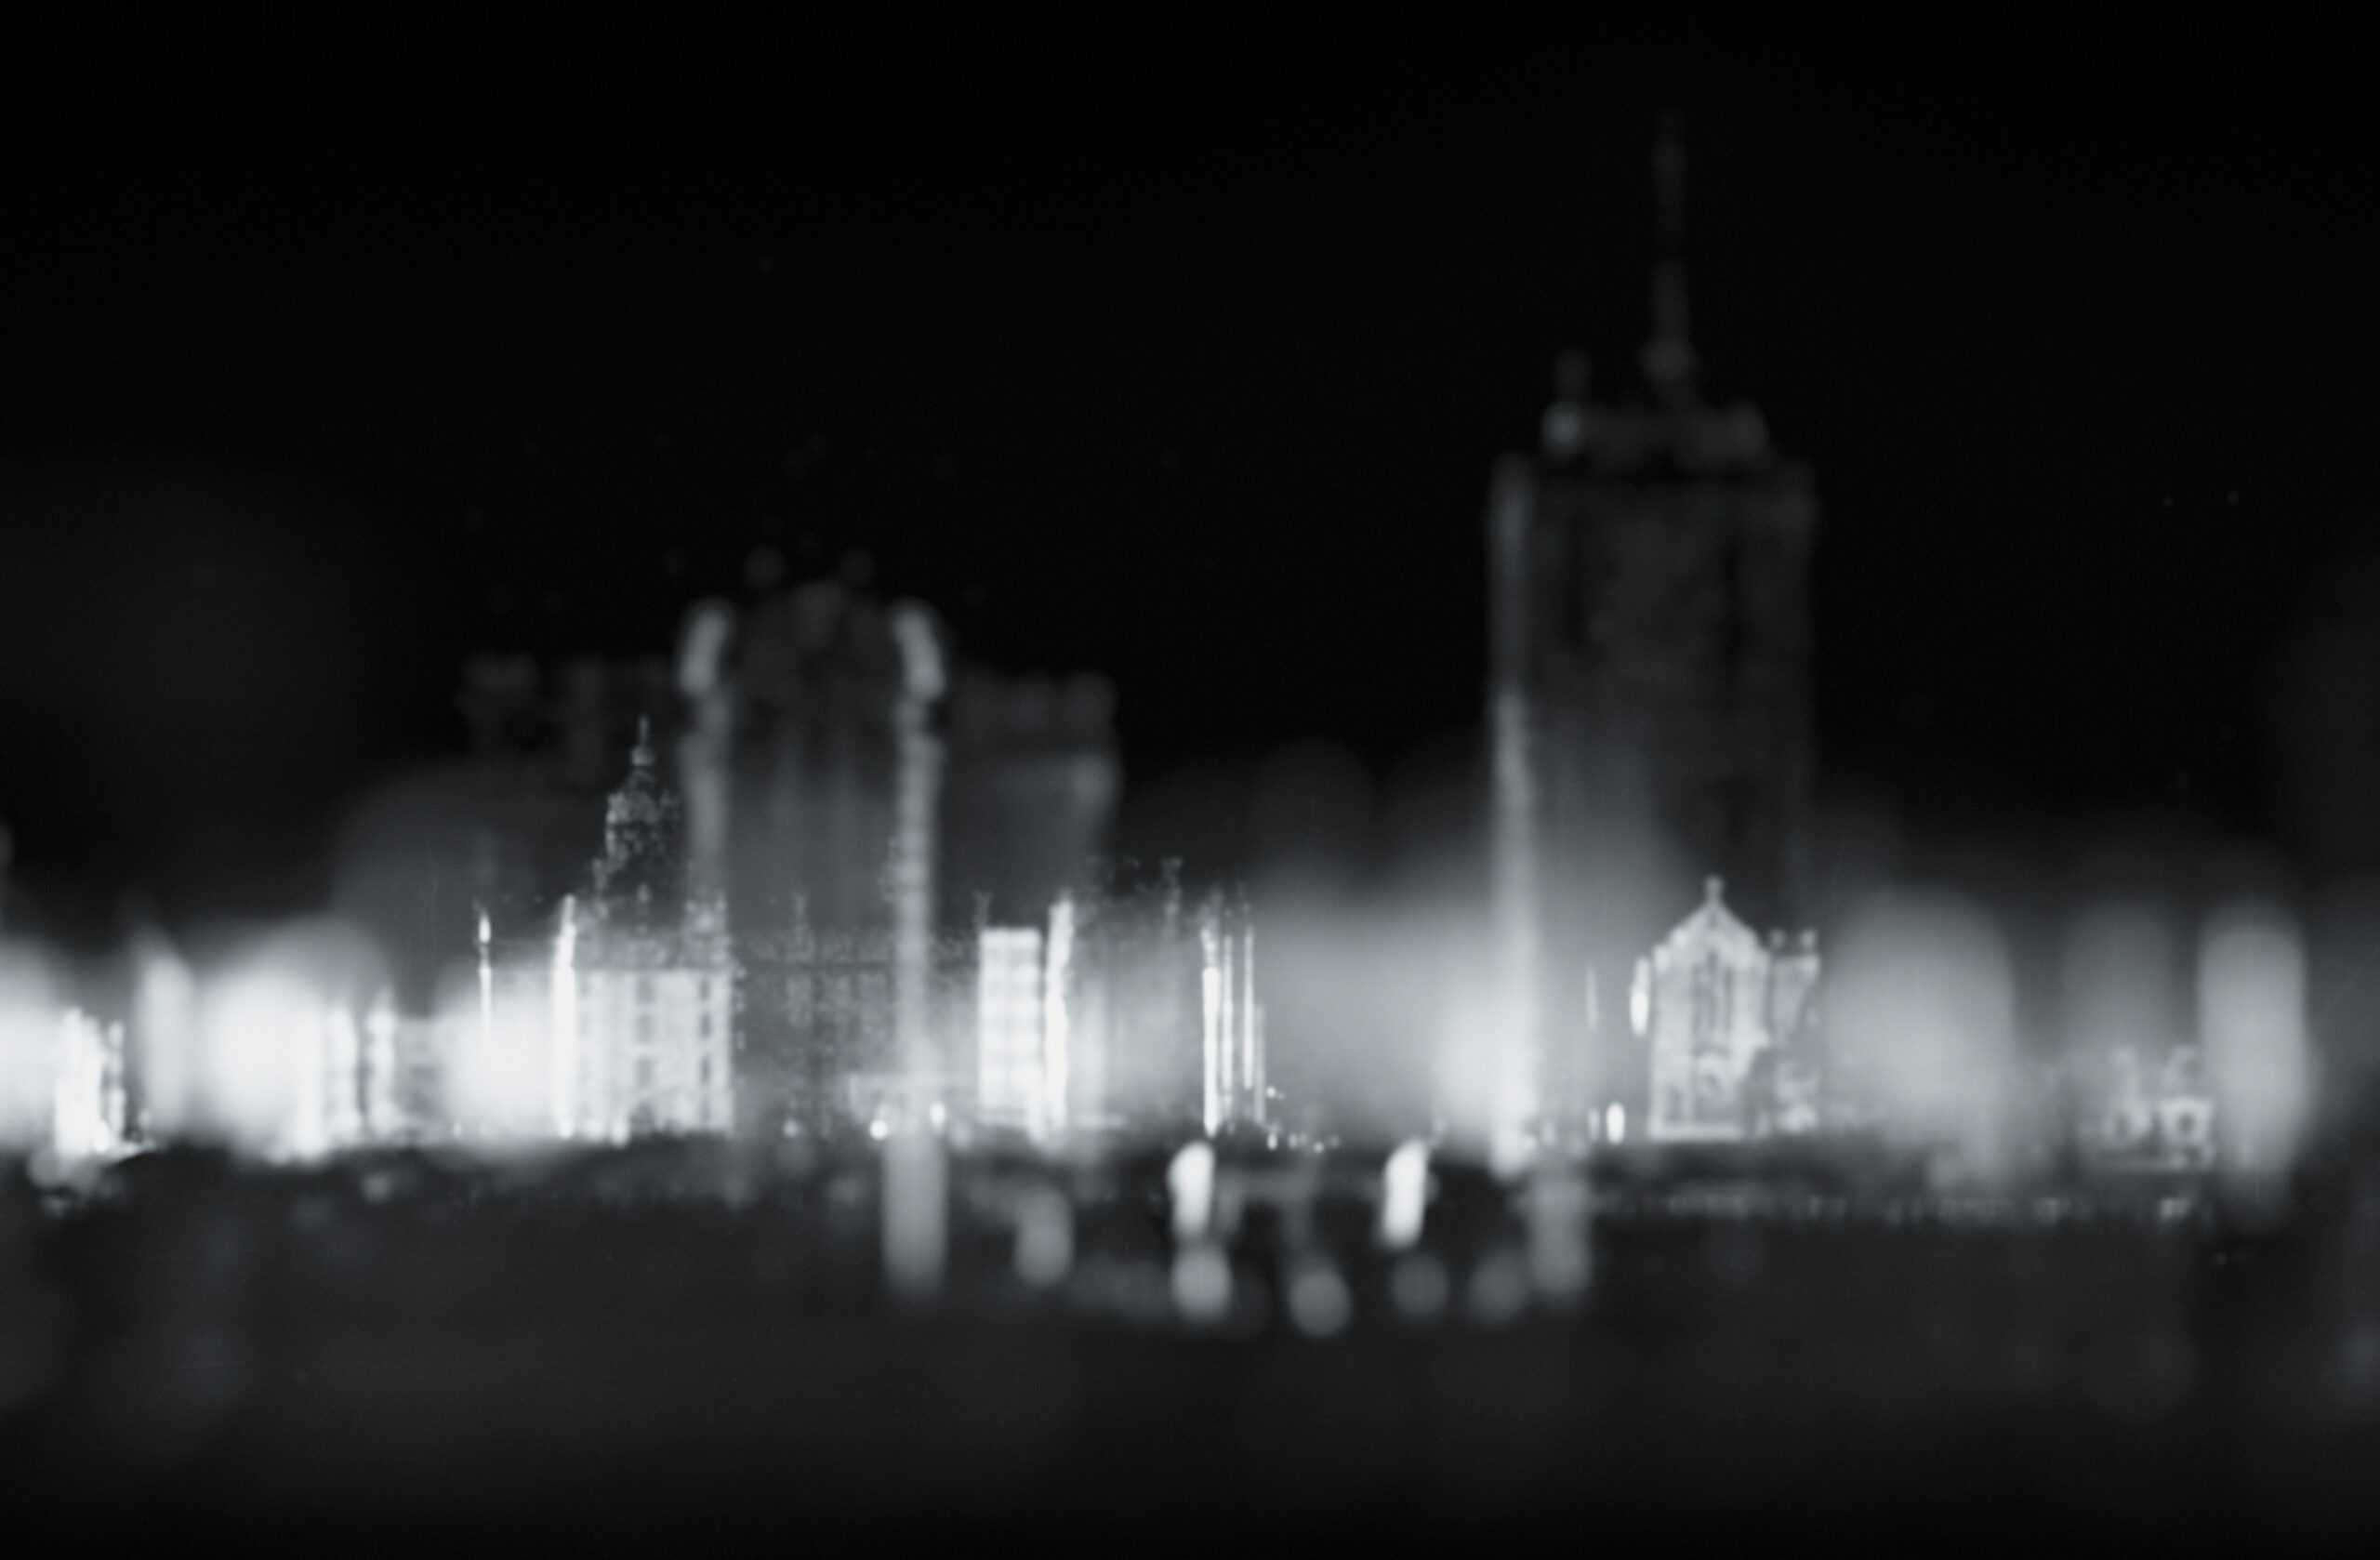
Points de repère is a poetic visualization and sonification of one year on the Plateau-Mont-Royal, a borough of the city of Montreal in Canada. Similarly to a satellite, a virtual camera gravitates around a point cloud model of the Plateau. Environmental data such as temperature, humidity, rain, snow and air pollution, measured by sensors and weather stations are sonified and determine how the 3D model is displayed. Data collected between September first 2012 and 2013 transform the space at a rate of one day per second as we make a 360 degrees revolution around it. By putting into play the Plateau’s fluctuating environmental conditions with its architecture, infrastructures and geography, this digital archaeology simultaneously reveals and dissimulates information about the location.
Environmental data determine the following aspects of the 3D point cloud and were used to generate the soundtrack through a sound synthesis process.
Length of day : Point size
Temperature : Point color values
Humidity : Point sharpness
Visibility and air quality : Depth of field parameters
Wind and precipitation : Point displacements
Atmospheric pressure : Vertical axis of the camera


Part of the exhibition Lives and Times of the Plateau, presented at Pointe-à-Callière, Montréal Museum of Archaeology and History. Thanks to Pointe-à-Callière, Daniel Canty and Multiple.
Links
Le Plateau s’invite au musée Pointe-à-Callière avec l’exposition «Vies de Plateau». Article by Ismaël Houdassine. Huffington Post. October 24th 2013.
Vies de Plateau: un quartier «chef de file». Article by Éric Clément. La Presse. October 21st 2013.
Pointe-à-Callière looks at the Lives and Times of the Plateau. Article by Robyn Fadden. Tourisme Montréal, October 30th 2013.
Points de repère, 2013.
3D animation with sound.
6 min. 5 sec. loop.
Points de repère is a visualization and sonification of one year on the Plateau-Mont-Royal, a borough of the city of Montreal in Canada. Similarly to a satellite, a virtual camera gravitates around a point cloud model of the Plateau. Environmental data such as temperature, humidity, rain, snow and air pollution, measured by sensors and weather stations are sonified and determine how the 3D model is displayed. Data collected between September first 2012 and 2013 transform the space at a rate of one day per second while the camera makes a 360 degrees revolution around it. By putting into play the Plateau’s fluctuating environmental conditions with its architecture, infrastructures and geography, this digital archaeology simultaneously reveals and dissimulates information about the location.
Environmental data determine the following aspects of the 3D point cloud and were used to generate the soundtrack through a sound synthesis process.
Length of day : Point size
Temperature : Point color values
Humidity : Point sharpness
Visibility and air quality : Depth of field parameters
Wind and precipitation : Point displacements
Atmospheric pressure : Vertical axis of the camera
Part of the exhibition Lives and Times of the Plateau, presented at Pointe-à-Callière, Montréal Museum of Archaeology and History. Thanks to Pointe-à-Callière, Daniel Canty and Multiple.
Links
Le Plateau s’invite au musée Pointe-à-Callière avec l’exposition «Vies de Plateau». Article by Ismaël Houdassine. Huffington Post. October 24th 2013.
Vies de Plateau: un quartier «chef de file». Article by Éric Clément. La Presse. October 21st 2013.
Pointe-à-Callière looks at the Lives and Times of the Plateau. Article by Robyn Fadden. Tourisme Montréal, October 30th 2013.